Keeping Track

The basics..
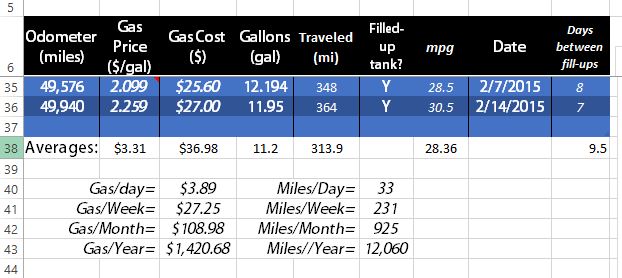
Initially I just wanted to get a running average of my car's mpg so I could better evaluate the effects of changes in driving style, weather and engine performance, deterioration of engine over time, etc. After reading through some search results I noticed that information could be extrapolated to give insights into other very useful trends. Web based and phone applications seemed too cumbersome so I set out to do it using a common tool: Excel. The first and most important thing was gathering as much data as possible from each fill-up; the fields in bold are the information that I input to the sheet, italicized entries are calculated.
Noticing Trends
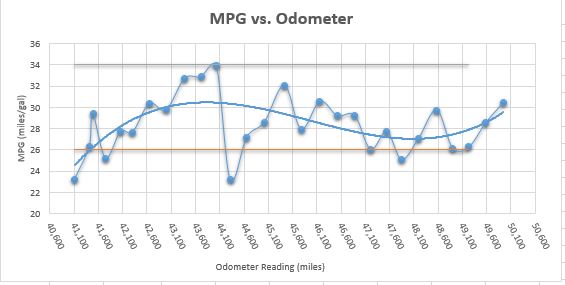
After gathering a few months of data, some trends started to emerge. I fitted the MPG vs Odometer graph was fitted with a 3rd order polynomial and found a lower MPG in winter months as expected.
Averages
The sheet also calculates averages where possible for each column. This allows me to calculate expected gas expenses per week, month and year as well as expected number of miles driven
Excel is a nice tool to use for this kind of data logging. To name a few, it lets you place notes in particular cells if there is any more detail to the entry, it's easily modifiable once the formulas are in place, it has more versatility than a web based or phone application, and you can even attach other documents like the owners manual.
You can find a link to the excel sheet by clicking here.